Exploring AWS CloudWatch Alarms
TABLE OF CONTENTS
Introduction
Recently, I've worked on implementing AWS CloudWatch metrics and alarms in a data project that has its infrastructure defined using AWS CDK. Before starting with the implementation, I had a big-picture understanding of CloudWatch alarms and how they work, since I mostly worked on dashboards and alerts in Grafana.
Grafana is pretty straightforward, defining dashboards and alerts based on AWS metrics/logs is simple as creating a query, evaluation period, and some thresholds for alerts. Starting with CloudWatch alarms, I thought the same approach - more or less - could be applied. However, when I stumbled upon missing data logic and different behaviors, I realized that CloudWatch alarms have a lot of details that are not intuitive at first (at least not for me).
Having this in mind and also spending some time on researching and understanding CloudWatch in general, I've decided to write an introductory blog post - explaining some ideas behind CloudWatch metrics and alarms, how they work, and how to implement them in a CDK application. It can serve as a starting point to flatten the learning curve, but also as a reference (especially for me :D).
Anyways, if you have any additional questions and suggestions, please don't hesitate to reach out.
Basics
Logic
AWS services emit different kinds of metrics. For example, Lambda has:
- Invocations metrics - such as Errors, number of Invocations, Throttles, Provisioned Concurrency Invocations...
- Performance metrics - Duration, Iterator Age...
- Concurrency metrics - Concurrent Executions, Unreserved Concurrent Executions, and so on...
The CloudWatch alarm is based on a CloudWatch metric. This type of an alarm is called a metric alarm. For instance, if we want to monitor Lambda errors, we can create a CloudWatch alarm based on Lambda Invocation Errors metric.
Additionally, there is also a "composite alarm" which is based on multiple alarms.
Metrics are some values and defining an alarm means that we need to set additional value for comparison i.e. threshold, and comparison type which is called comparison operator. This operator evaluates the alarm based on metric's value and threshold, and it can take the following forms:
GREATER_THAN_OR_EQUAL_TO_THRESHOLDGREATER_THAN_THRESHOLDGREATER_THAN_UPPER_THRESHOLD-
LESS_THAN_LOWER_OR_GREATER_THAN_UPPER_THRESHOLD LESS_THAN_LOWER_THRESHOLDLESS_THAN_OR_EQUAL_TO_THRESHOLDLESS_THAN_THRESHOLD
Now that we have a value, threshold, and a way to compare them, the question is: when to compare them? This is where the periods come into play. There are two kinds of periods:
- Period - time period to evaluate the metric and create a datapoint
- Evaluation Period - number of most recent periods i.e. datapoints used to determine the alarm state
Imagine a graph, the x axis represents the time. If we set the period to 1 minute, that means that for each minute on x axis we will have a datapoint i.e. metric value.
The evaluation period sets how many periods/datapoints we are taking into account when evaluating the alarm. If we want to evaluate 3 most recent datapoints, we will set evaluation period to 3. However, the question is: How do we treat these 3 points? Are all 3 required to breach the threshold?
This question is answered by an additional parameter: Datapoints to Alarm - number of datapoints within the evaluation period that must be breaching to trigger the alarm.
AWS documentation - Using Amazon CloudWatch alarms - offers a nice example:
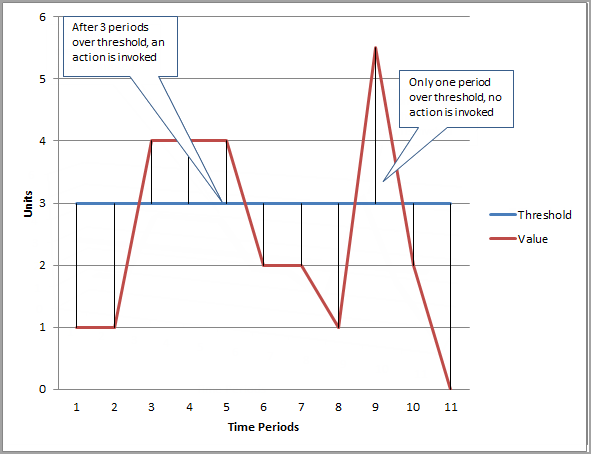
Image Source: AWS documentation - Using Amazon CloudWatch alarms
In this example, the threshold is set to 3 units, evaluation period is 3, and datapoints to alarm is also 3. We can see that the alarm action is triggered only if all 3 datapoints are breaching within the evaluation period of 3 periods. If only one datapoint is breaching, no action is triggered, as stated in the graph.
The "datapoints to alarm within evaluation period" can be expressed as "M out of N". If you are creating an alarm through the AWS console, you'll see "M of N" in the advanced settings.
The important thing to note is that for periods >= 1 minute, the alarm is evaluated each minute and the evaluation is based on the configured period and evaluation period. This practically means that we have a sliding window of evaluation. For example, if we have a period of 5 minutes, and the evaluation period of 1, the evaluation will take place between 1 and 5, but also 1 minute later i.e. between 2 - 6.
Code
There are two ways to create a CloudWatch alarm:
- Create a metric and then use
create_alarm()method or - Use the
Alarmclass and pass the metric
Of course, the end result is the same. As an example, let's create an alarm for Lambda errors.
lambda_func =aws_lambda.Function(
    stack,
    id="lambda",
    handler="hello.handler",
    code=aws_lambda.Code.from_asset(<handler.path>),
    runtime=aws_lambda.Runtime.PYTHON_3_10,
)
errors_metric = lambda_func.metric_errors(
    period=Duration.minutes(5),
    statistic="sum",
)
errors_metric.create_alarm(
    stack,
    id="lambda-errors-alarm",
    evaluation_periods=1,
    threshold=1,
    alarm_description="Testing Lambda Errors Alarm",
    alarm_name="test-lambda-errors-alarm",
    comparison_operator=aws_cloudwatch.ComparisonOperator.GREATER_THAN_OR_EQUAL_TO_THRESHOLD,
)
The metric_errors() returns a Lambda invocation errors metric. We can do the same by explicitly
specifying the metric name using metric():
errors_metric = lambda_func.metric(
    metric_name="Errors",
    period=Duration.minutes(5),
    statistic="sum",
)
After synthing the application, we get:
"lambdaerrorsalarmF85101B3": {
    "Type": "AWS::CloudWatch::Alarm",
    "Properties": {
        "ComparisonOperator": "GreaterThanOrEqualToThreshold",
        "EvaluationPeriods": 1,
        "AlarmDescription": "Testing Lambda Errors Alarm",
        "AlarmName": "test-lambda-errors-alarm",
        "Dimensions": [
            {
                "Name": "FunctionName",
                "Value": {
                    "Ref": "lambda8B5974B5"
                }
            }
        ],
        "MetricName": "Errors",
        "Namespace": "AWS/Lambda",
        "Period": 300,
        "Statistic": "Sum",
        "Threshold": 1
    }
}
The same can be achieved using the Alarm class:
errors_metric = lambda_func.metric_errors(
    period=Duration.minutes(5),
    statistic="sum",
)
aws_cloudwatch.Alarm(
    stack,
    id="lambda-errors",
    comparison_operator=aws_cloudwatch.ComparisonOperator.GREATER_THAN_OR_EQUAL_TO_THRESHOLD,
    threshold=1,
    evaluation_periods=1,
    metric=errors_metric,
)
Metric Filter
In the previous example, we've defined an alarm using a service metric. This metric is emitted
to CloudWatch by default, we don't have to set up anything in order to get the metric. However,
what if we want to define an alarm on a custom metric that's gathered from the logs? In that case,
we have to define a MetricFilter, which is a filter that extracts the information from the
CloudWatch Logs and emits it to the CloudWatch Metrics.
If you want to create/find metric filters in the console - go to the CloudWatch logs, select a log group and go to Metric Filters tab.
Let's say we have something in the Lambda's logs that we want to monitor. The idea is the following:
- Create a Lambda function
- Define a Metric Filter with a Filter Pattern and reference the lambda's log group
- Create a Metric based on the Metric Filter
- Finally create an Alarm based on the Metric
The Filter Pattern defines what we want to match and emit as a metric. It takes the form of { PropertySelector EqualityOperator Value },
where the PropertySelector is defined as $.{property}, for example: $.eventType, $.latency, $.errorCode, etc.
For more information about the syntax please check Filter and pattern syntax documentation
Therefore, to match a log message we would use $.message = <text>.
Additionally, FilterPattern can use multiple patterns for matching. We can define multiple patterns and emit a metric if any of the patterns match:
FilterPattern.any(
    FilterPattern.boolean_value("$.error", True),
    FilterPattern.number_value("$.latency", ">", 1000)
)
For complete documentation, see FilterPattern
Metrics belong to a metric namespace. For example, all Lambda service metrics are under
AWS/Lambda namespace (see the Cloudformation template above). However, when we create a custom
metric, we have to specify the metric namespace. The actual naming can be anything you like, but
generally defines a group of metrics for a particular use case on the project.
Doing this in the CDK:
lambda_func =aws_lambda.Function(
    stack,
    id="lambda",
    function_name="test-lambda",
    handler="hello.handler",
    code=aws_lambda.Code.from_asset(<handler-path>),
    runtime=aws_lambda.Runtime.PYTHON_3_10,
)
metric_filter = aws_logs.MetricFilter(
    stack,
    id="metric-filter",
    log_group=lambda_func.log_group,
    filter_pattern=aws_logs.FilterPattern.string_value("$.message", "=", "test"),
    metric_name="custom-log",
    metric_namespace="lambda",
    metric_value="1",
)
metric = metric_filter.metric(
    period=Duration.minutes(5),
    statistic="sum",
)
metric.create_alarm(
    stack,
    id="lambda-logs",
    comparison_operator=aws_cloudwatch.ComparisonOperator.GREATER_THAN_OR_EQUAL_TO_THRESHOLD,
    threshold=1,
    evaluation_periods=1,
)
The metric_value argument for MetricFilter sets the value to be emitted for the metric. In this
case, if we match the log message, we want to send 1. Depending on the context, we can also send
the field's value. For instance, if we are monitoring the latency, we can send the actual latency
value using "$.latency".
Synthing the application gives the following:
"metricfilterA896D132": {
    "Type": "AWS::Logs::MetricFilter",
    "Properties": {
        "FilterPattern": "{ $.message = \"test\" }",
        "LogGroupName": {
            "Fn::GetAtt": [
                "lambdaLogRetention4CE10F74",
                "LogGroupName"
            ]
        },
        "MetricTransformations": [
            {
                "MetricName": "custom-log",
                "MetricNamespace": "lambda",
                "MetricValue": "1"
            }
        ]
    }
},
"lambdalogsA7B16D27": {
    "Type": "AWS::CloudWatch::Alarm",
    "Properties": {
        "ComparisonOperator": "GreaterThanOrEqualToThreshold",
        "EvaluationPeriods": 1,
        "MetricName": "custom-log",
        "Namespace": "lambda",
        "Period": 300,
        "Statistic": "Sum",
        "Threshold": 1
    }
}
If you want to check metric namespaces in the console, go to CloudWatch - All Metrics tab. Keep in mind that it'll take some time for a new namespace to appear in the console (at least it took ages in my case).
Math Expression
We can apply some calculations on multiple CloudWatch metrics and create new time series that can be later used for different kinds of alarms.
Let's say we want to monitor how each datapoint differs from the average value in the time series.
The fist step is to create a metric, then we define the
MathExpression
with expression m - AVG(m) where m references the metric, and finally create an alarm.
metric = lambda_func.metric_invocations(
    period=Duration.minutes(5),
    statistic="max",
)
avg_diff = aws_cloudwatch.MathExpression(
    expression="m - AVG(m)",
    using_metrics={
        "m": metric,
    }
)
avg_diff.create_alarm(
    stack,
    id="lambda-logs",
    comparison_operator=aws_cloudwatch.ComparisonOperator.GREATER_THAN_OR_EQUAL_TO_THRESHOLD,
    threshold=1,
    evaluation_periods=1,
)
The template for the alarm is the following:
"lambdalogsA7B16D27": {
    "Type": "AWS::CloudWatch::Alarm",
    "Properties": {
        "ComparisonOperator": "GreaterThanOrEqualToThreshold",
        "EvaluationPeriods": 1,
        "Metrics": [
            {
                "Expression": "m - AVG(m)",
                "Id": "expr_1"
            },
            {
                "Id": "m",
                "MetricStat": {
                    "Metric": {
                        "Dimensions": [
                            {
                                "Name": "FunctionName",
                                "Value": {
                                    "Ref": "lambda8B5974B5"
                                }
                            }
                        ],
                        "MetricName": "Invocations",
                        "Namespace": "AWS/Lambda"
                    },
                    "Period": 300,
                    "Stat": "Maximum"
                },
                "ReturnData": false
            }
        ],
        "Threshold": 1
    }
}
The previous example acts on a single metric, but the same can be done for multiple metrics.
avg_diff = aws_cloudwatch.MathExpression(
    expression="m1 - AVG(m2) + m3 + FLOOR(m4)",
    using_metrics={
        "m1": metric_1,
        "m2": metric_2,
        "m3": metric_3,
        "m4": metric_4,
    }
)
It all depends on the requirements and what you want to achieve. The MathExpression offers a
plethora of different kinds of functions that allow you to fine-tune the time series. Be sure to
check out the Use metric math
documentation for more information and detailed examples.
Missing data
Services emit data when something happens. Taking Lambda as an example, it will emit metrics only when it's invoked, otherwise CloudWatch won't receive the data. Additionally, something may go wrong with the service, connection, servers etc, and we end up with some missing data. CloudWatch alarm allows us to act on this missing data by specifying how it treats the missing data:
BREACHING- Missing data will be treated as breaching the thresholdIGNORE- Missing data will be ignored and the alarm will keep its stateMISSING- Alarm evaluation won't take missing data into account, but if all datapoints are missing. The alarm will go intoINSUFFICIENT_DATAstate.NOT_BREACHING- Missing data is within the threshold
When creating an alarm in the CDK, we can pass the treat_missing_data argument to define the behavior.
cloudwatch.Alarm(
    self,
    id="Alarm",
    treat_missing_data=aws_cloudwatch.TreatMissingData.IGNORE,  # <-----
    ...
)
You may be thinking that if one period passes and CloudWatch doesn't receive some data, it'll immediately trigger the state change. Well... It doesn't work like that.
For evaluating missing data, CloudWatch defines something that it calls evaluation range. This range depends on the length of the alarm period and the metric resolution. This range is used to retrieve higher number of data points than the number specified as evaluation period.
In other words, it'll take multiple periods for CloudWatch to evaluate that the data is missing, and that could cause some unexpected results.
For example, I've found a
StackOverflow question
where a user explains how they've defined a CloudWatch alarm with period 1 day, data points to
alarm 1 of 1, missing data treatment as BREACHING, and action to send an email if alarm goes to
ALARM state. They expected that they would receive an email if the data was missing for the
whole day. However, what happened is that they waited 3 to 4 days for the alarm to go into ALARM
state and trigger the action.
How to deal with this case depends on the context, but for most implementations we can replace
the missing data with 0. If we wait for a metric to have a numeric value, and it turns out that
the data is missing for some reason, that's the same as having 0. Therefore, we can define a
MathExpression with FILL(m, 0). Doing so will send the metric value m if present, otherwise 0.
avg_diff = aws_cloudwatch.MathExpression(
    expression="FILL(m, 0)",
    using_metrics={
        "m": metric,
    }
)
Looking at the Cloudwatch Alarm graph, you'll see that the missing data is treated as 0
(the blue line) and the alarm goes into ALARM state after one period. Basically, we've avoided
the missing data logic and evaluation range.
Additional details and the in-depth explanation of how CloudWatch evaluates the alarm when the data is missing can be found at Configuring how CloudWatch alarms treat missing data under "How alarm state is evaluated when data is missing" subsection.
Thank you for taking the time to read this blog post! I hope you found it informative and valuable. If you have any questions or suggestions, please don't hesitate to reach out.